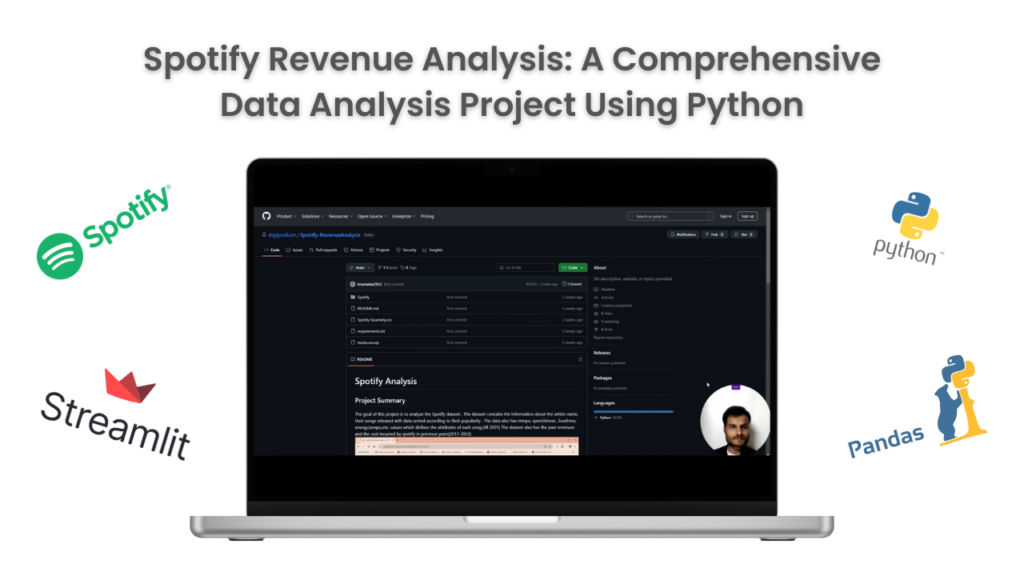
In the age of streaming platforms, Spotify remains one of the leading services for music lovers worldwide. But have you ever wondered about the factors that influence Spotify’s revenues and song popularity? If so, the Spotify Revenue Analysis GitHub project by digipodium is a perfect place to start. This data-driven project dives deep into Spotify’s past revenue trends, song attributes, and artist popularity, providing insightful analysis using Python, Pandas, and Streamlit.
This blog post will guide you through the project structure, objectives, datasets, and tools used, helping you get started with this interesting analysis.
Project Overview
The Spotify Revenue Analysis project aims to analyze Spotify’s dataset, exploring two core components:
- Song Attributes & Popularity: Examining song features such as tempo, energy, loudness, speechiness, and how these attributes contribute to popularity.
- Revenue Trends: Analyzing Spotify’s revenue and incurred costs from 2017 to 2023 to understand the company’s financial performance.
This project utilizes Python as the primary programming language and Streamlit to build an interactive web application for data visualization.
Tech Stack
To ensure a smooth and user-friendly analysis experience, the project leverages the following tools and libraries:
- Python: Core language for data analysis.
- Pandas: Used for data manipulation and cleaning.
- Streamlit: To create an interactive and visually appealing web interface.
- Plotly: For dynamic and interactive data visualizations.
Datasets Used
The project uses two datasets:
- Spotify Quarterly.csv: Contains financial information about Spotify, such as revenues and costs over the years (2017-2023).
- tracks.csv.zip: Contains detailed song attributes, including:
- Artist Name
- Track Name
- Popularity
- Tempo
- Loudness
- Speechiness
- Energy
These datasets provide a comprehensive view of both Spotify’s financial data and music attributes.
Project Installation
Follow these simple steps to set up and run the Spotify Revenue Analysis project:
1. Clone the Repository
Start by cloning the GitHub repository to your local system:
git clone https://github.com/digipodium/Spotify-RevenueAnalysisReplace <repo-url> with the actual repository URL.
2. Install Dependencies
Navigate to the project directory and install all required dependencies using the requirements.txt file:
pip install -r requirements.txt3. Run the Streamlit Application
Once the dependencies are installed, launch the Streamlit app by running the following command:
streamlit run Spotify/SpotifyAnalysis.pyThis will open an interactive web application in your browser, where you can explore the analysis.
Features of the Project
Here are the key features and outputs of the Spotify Revenue Analysis project:
- Revenue Trends Visualization: The financial dataset from 2017 to 2023 is analyzed to display Spotify’s revenue trends and cost patterns using visual graphs.
- Song Popularity Analysis:
- Explore song attributes like tempo, loudness, speechiness, and energy.
- Identify correlations between song attributes and popularity scores.
- Interactive Web Application:
- Built using Streamlit, the app allows users to filter, analyze, and visualize the datasets interactively.
- Easy navigation through revenue trends and song features.
- Dynamic Visualizations: With Plotly, the project offers visually appealing and dynamic charts to make data analysis more engaging.
Why Is This Project Important?
This project serves as an excellent example of how data analysis can provide actionable insights into:
- Financial Growth: Understanding how a streaming platform like Spotify has grown over time.
- Music Trends: Identifying what makes a song popular based on its attributes.
- Interactive Analytics: Using modern tools like Streamlit and Plotly to create user-friendly dashboards.
Whether you’re a data scientist, music enthusiast, or finance analyst, this project showcases the power of combining data and visual storytelling.
How to Contribute
If you’d like to contribute to the project, follow these steps:
- Fork the repository on GitHub.
- Clone the forked repository to your local machine.
- Create a new branch for your changes:
git checkout -b feature-branch - Make your changes and push them to your branch.
- Create a pull request on the main repository.
Any contributions to improve the code, visualizations, or functionality are welcome!
Conclusion
The Spotify Revenue Analysis project is an impressive data analysis initiative that combines Python programming with modern visualization tools. By exploring song attributes and Spotify’s financial performance, it provides a comprehensive understanding of how streaming trends and revenue growth align.
If you’re interested in data analysis, music trends, or financial analytics, this project is a must-try. Follow the installation guide, run the Streamlit app, and explore the fascinating insights hidden in the Spotify dataset!
Repository Link: Spotify-RevenueAnalysis